By Gideon T. Rasmussen, CISSP, CRISC, CISA, CISM, CIPP
September, 2013
Effective conversations are required to establish and maintain an information security program. This article provides guidance for creating presentations with an emphasis on risk, with business executives as the intended audience.
Sample slides can be viewed at this link.
I. The Audience
Start by considering who you are presenting to and what resonates with them. System Administrators and Developers want low-level details such as how a vulnerability can be exploited and steps to remediate it. Compliance professionals tend to think in binary terms; a requirement is either in place or it is not. Make a compelling case for compensating controls if appropriate. Executives want a concise explanation. Make your point quickly and answer the ?so what? question. Business executives are focused on products and services that generate revenue. They are also mindful of costs that impact the bottom line. Explain security issues in terms of business risk. If you are not familiar with the audience, ask advice from someone who is.
Design your slide deck to match the meeting format and presentation time period. If you are allotted one slide in a shared presentation, use a 4-blocker format. If you are meeting with an executive for 30 minutes, prepare four to six slides and leave time for conversation. If you are being injected into a meeting routine, ask about the background of the audience and how long you have to present. A large number of slides may be appropriate if you are presenting a program overview, training or an awareness briefing. Determine if the deck is meant only to be presented or if it should stand alone as well.
II. Frame the presentation
Create an outline of the topics you want to discuss. Think about what you are trying to convey to the audience and what their motivations are. The Title Slide should describe the topic of the presentation. Use an Overview Slide to display sub-topics and frame the story. At the conclusion of the deck, summarize the topics that were addressed and provide a call to action. Include a Questions and Discussion slide to open the floor to conversation. Provide an Appendix for ?back pocket? material, with references, supporting data and resource links.
III. Visualizations
Visualizations can be used to tell a powerful story. The slide deck is the palate; visualizations are the paint. This is especially true when transforming data into a risk narrative.
Visualization
Risk Context
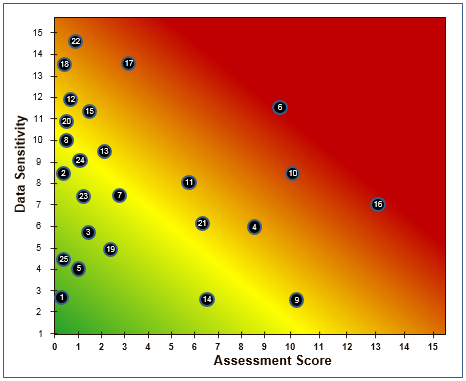
Heat MapA Heat Map combines shades of green, yellow and red with a scatter chart to represent risk (e.g. of systems, applications, or suppliers). The outliers in orange and red zones warrant attention.
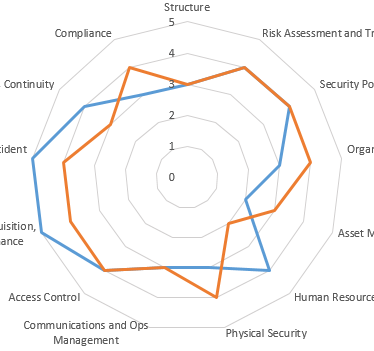
Spider DiagramA Spider Diagram is a great way to display program maturity by a standard such as ISO 27002. It can also be used to compare your company to an industry baseline.
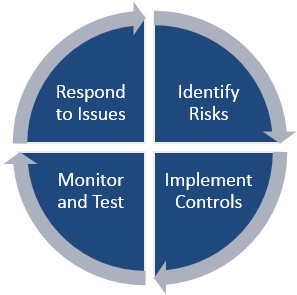
Cycle DiagramA Cycle Diagram can be used to demonstrate alignment of functions in your organization to a best practices control framework.
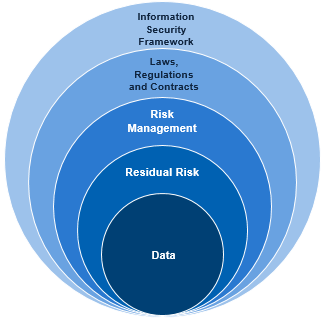
Venn DiagramA Venn Diagram can be used to represent layers of controls that protect an asset.
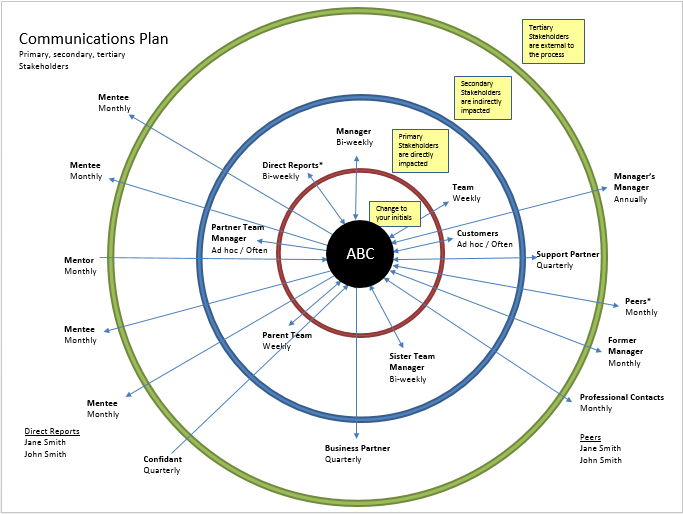
Communications PlanEffective communications are critical to risk management. Document existing routines.
Look for gaps and communications that should be discontinued.
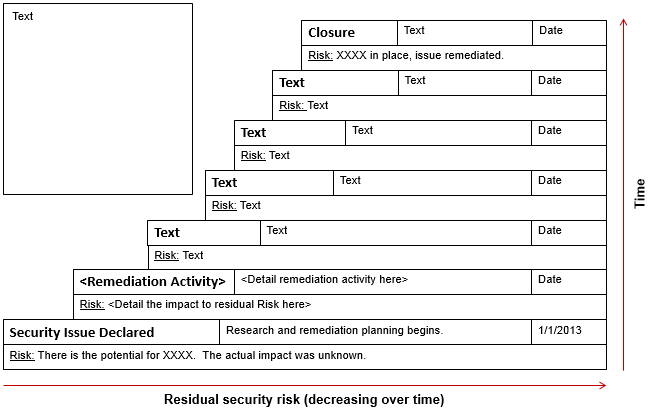
Stair StepA Stair Step visualization can be used to represent how risk is reduced over time as the result of
remediation activity or implementation of compensating controls. It can also be used to demonstrate accomplishments
(e.g. how risk was reduced through the activities of a team).
![]()
TableA Table visualization can be used to evaluate a risk model. This example displays applications
stack ranked by a new risk score, with gaps in control deployment highlighted in blue. Tables can also be
used to display risk matrixes or information classified by Confidentiality, Integrity and Availability ratings.
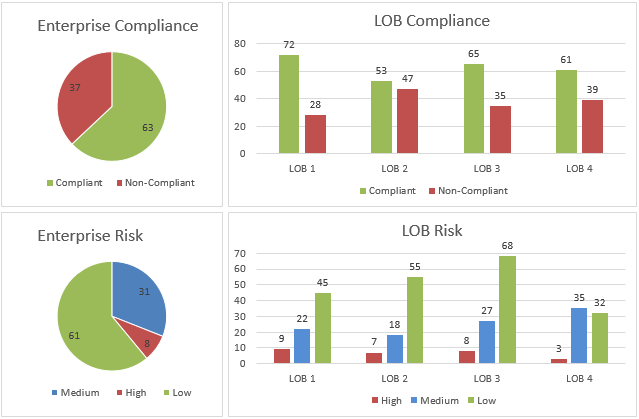
Pie and Bar ChartsPie Charts can be used to provide risk and compliance statuses for the company.
Bar Charts can be used to drill down and compare organizations and the executives that manage them.
CustomCustom visualizations can be the most compelling. Start with a piece of paper and brainstorm.
IV. Slide Formats
Failure Mode and Effects Analysis: FMEA is a practical way to conduct a technical risk assessment. Failure modes are rated by Severity, Occurrence and Detection. That results in a Risk Priority Number. Use RPN scores to prioritize remediation. The highest RPN values correspond to issues with the greatest potential for business impact.
SWOT Analysis: SWOT is an abbreviation for Strengths, Weaknesses, Opportunities, and Threats. SWOT analysis can be used annually to evaluate the program. The SWOT slide highlights opportunities for improvement, which may result in increased funding.
Multi-Generational Plan (MGP): It takes time to mitigate risk. An MGP can be used to convey phases in a project or steps to increase program maturity.
Block: The Block format can be useful if you are only allowed to present one slide. Fill four to six blocks with bulleted narrative or visualizations. Use a Block slide at the beginning of the year. Provide management themes in the title of each block and goals within the bullets. That same slide can be leveraged to communicate accomplishments at the end of the year.
V. Summary
Business executives live fast-paced lives and must make difficult decisions daily. Make every effort to anticipate their point of view and questions that may arise. Think of cost effective ways to protect the interests of the company; the processes that make it competitive and generate revenue. Provide rationale and risk transparency when asking for resource priority or funding.
Never underestimate the power of the spoken word combined with a slide deck. Visualizations are an effective way to get your point across.
About the author:
Gideon T. Rasmussen is a Charlotte-based Information Security Risk Manager with over 15 years experience in corporate and military organizations. His website is www.gideonrasmussen.com. The opinions expressed here are those of Gideon Rasmussen and do not necessarily represent those of his current or past employers.
Originally published by RiskCenter (September, 2013)